
In this blog post, I’ll show you how to create custom reports in GA4 that will give you all the information you need on your Google Ads performance. We’ll also provide tips on how to use these reports to improve your campaigns. Let’s get started!
Google Ads reports in Google Analytics are the best way to measure campaigns, understand visitor behavior related to paid traffic and get in-depth information about key performance indicators. For example, suppose you use Google Ads for search engine marketing, display advertising, remarketing, or other campaign types. Installing the Google Analytics Tracking Code on your website is highly recommended, and then linking both accounts.
Connecting Google Ads to GA4
The first step is to make sure you have access to both accounts. You will need Edit rights in GA4 and admin access in Google Ads. You have to use the same email.
Then go to your GA4 account. Find settings on the left expandable menu at the bottom. You should see a gear icon.
In the property column, find Product links and Google ads.
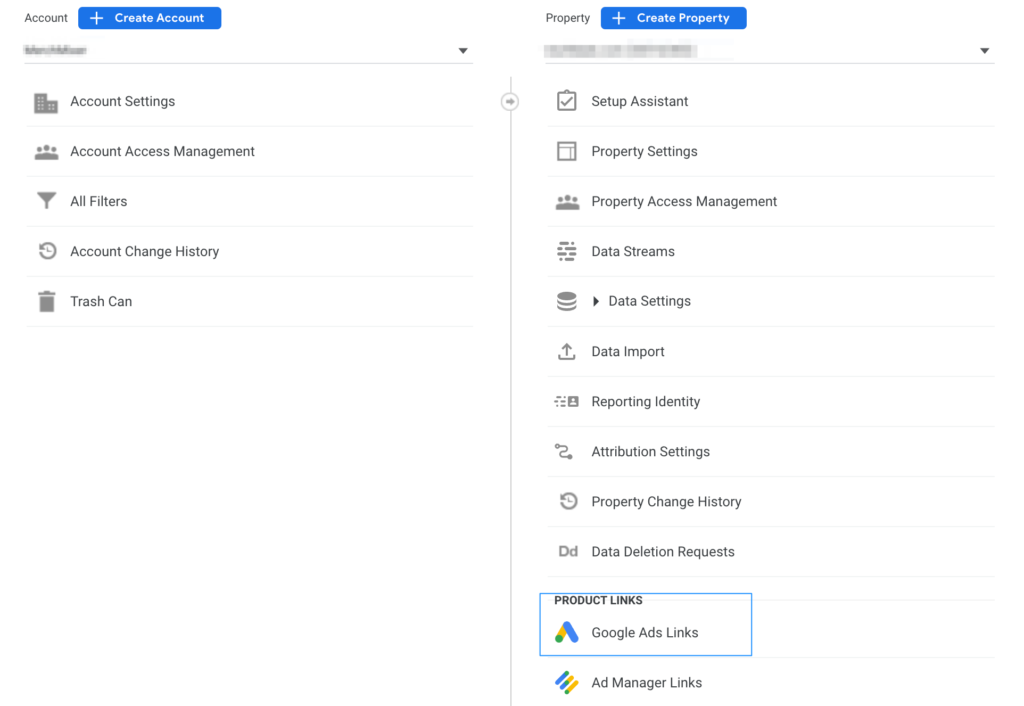
Click on it. You shouldn’t see any links if it’s a new GA4 account. But there might be links to older Google ads accounts. If not in use, you should unlink them.
Click Link, and you will be prompted to select your Google Ads account. I have many, so Google gives me a list of where I find the one I need.

You might have only one account. Select it.
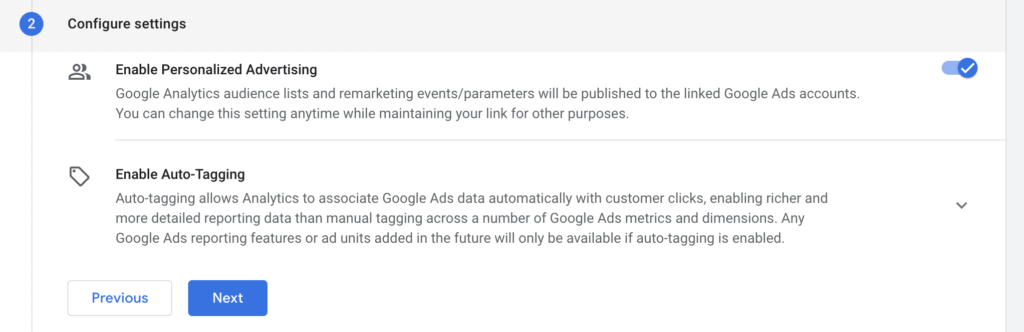
Leave the default settings with personalized advertising and auto-tagging enabled. Click next and then confirm and save.
Now your accounts are linked, and the data from Google Ads is available in your GA4 account.
Standard traffic acquisition reports in GA4
There have been many debates about GA4 and its differences from Universal Analytics. I’m not a fan. Universal Analytics is going away in the summer of 2023. Some say this date will be postponed.
But that does not change the fact that sooner or later, Universal Analytics is going away, and you will have to use GA4.
Let’s see where you can find your standard reports with data from Google ads. Click on reports in the left menu, find Acquisition, expand it, and you should see Google Ads campaigns.

You will see a big table with a bunch of combined data from GA4 and Google ads. That is one benefit. You can compare side-to-side sessions, users, engagement and cost, revenue, and return on ad spend.
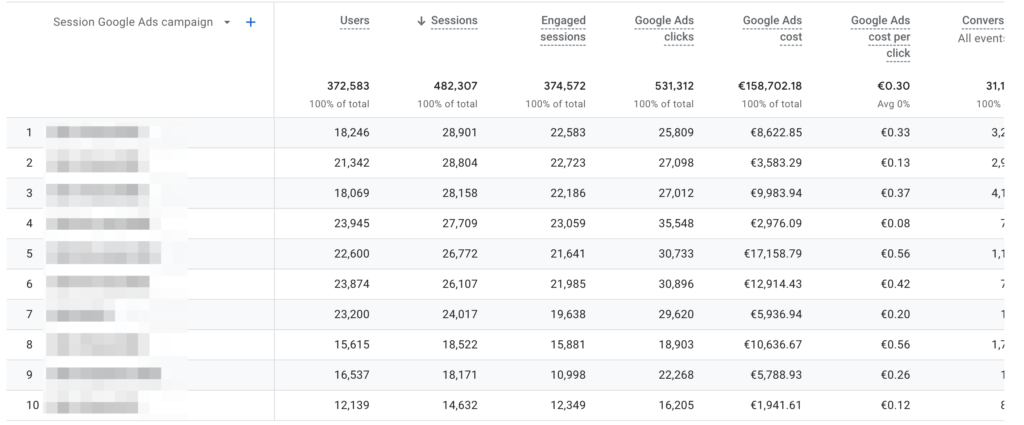
You will always have more clicks than users. The reason is that one user can perform many clicks. Think of a user as a unique person. Sessions are all different metrics and don’t have to match.
This table is like a big picture of your campaigns. You can draw some insights here, but primarily high-level stuff.
By default, you’re viewing your campaigns here. But you can change that by clicking a dropdown above (I know I’m pointing to a plus sign).
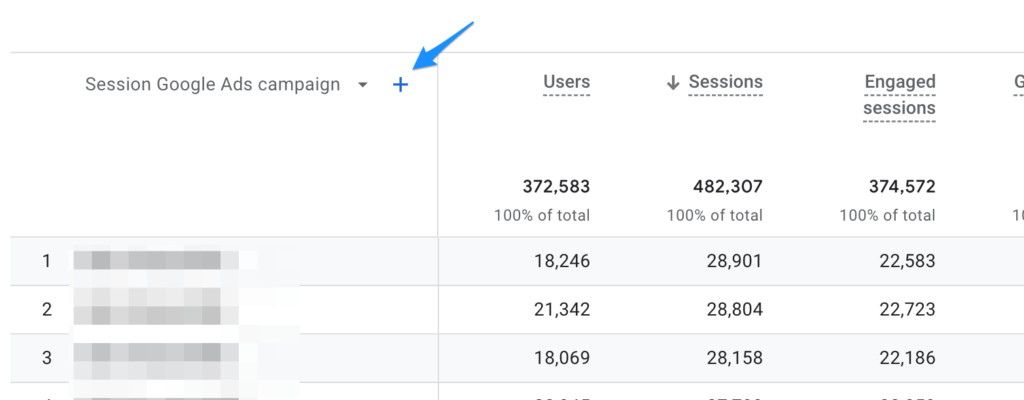
It will give you different views, such as ad groups or keywords.
The small blue plus I was pointing to in the screenshot above allows you to add a second dimension, similar to Universal analytics.

For example, I can add a device category, and my report will be split by mobile, desktop, and tablet. The downside is that it is hard to analyze and compare if you have a lot of campaigns. This is where custom reports come in, but we will get to that shortly.
Standard reports are just that, standard. They give you some insights into how your traffic from Google Ads performs, but they usually are too clunky. I prefer building my reports to get a better insight into my campaigns.
What do you want to measure?
Before we build any reports, we must decide what to measure. What are your business goals?
Are you looking to increase traffic to your website? Drive more leads? Increase sales? Each goal requires a different set of metrics, so let’s look at each.
Traffic
This is quite a common goal but not recommended. Many advertisers say they just want more traffic because they assume it will turn into sales or leads. And that is a common misconception. It is more complicated. Especially when it comes to Google Ads and what keywords you have chosen.
But if you do want traffic, then default reports are enough for you. You want to know how many people came in, did they bounce or not, whether they were new visitors or returning, and how much you spent to get those people in.
Leads
Lead generation is a huge thing. A lot of business models rely on getting new leads. Suppose you have configured your goal settings in Google Analytics. In that case, you should see all conversions in the default reports.
What you need to focus on is where the leads are coming from. Particularly what keywords are bringing new leads and how much they cost. Cost per lead should be one of the top metrics you look at. You don’t want to spend more than that lead will generate revenue for your business.
Sales
If you’re measuring sales, you’ll want to use the eCommerce reports in Google Analytics rather than just looking at conversions (orders placed). It’s harder to set up, but if you have a developer at hand, that shouldn’t take more than a few hours. And many website platforms have apps that allow this integration with a few clicks. Here’s a plugin for Prestashop or another one for WooCommerce. I’m not saying they’re the best. But it was quite easy to find them. I’m sure spending an hour will yield far better results.
The most important metric here is revenue. You’re measuring ROI (return on investment). You want your campaigns to bring in more revenue than your ad cost. Don’t forget your margins, taxes, and other deductibles. You have to calculate how much you can spend so your campaigns are profitable at the end of the month.
You can go with standard reports, but it is much easier to create custom reports that show you exactly what you need.
Creating Google Ads reports in GA4
Like in Universal analytics, in GA4, you can create custom reports. Click Explore on the right side menu and select blank report.

We will create a report from scratch, so you know how to do it later.
What you see here is a blank canvas, sort to speak. You can add any metrics you want and slice your data in the most useful ways.

Let’s start with a simple overview report. Then, we will have our campaigns and the main metrics that could show us how we are doing.
We will add the following:
- Users
- Clicks
- Conversions
- Revenue
- Cost (ad spend)
Click to add metrics as shown below.

You can manually find each metric, or you can type into a search, like here:

Then select the metric you want, and you can search for the next one. Once all of the metrics are selected, click on Import.
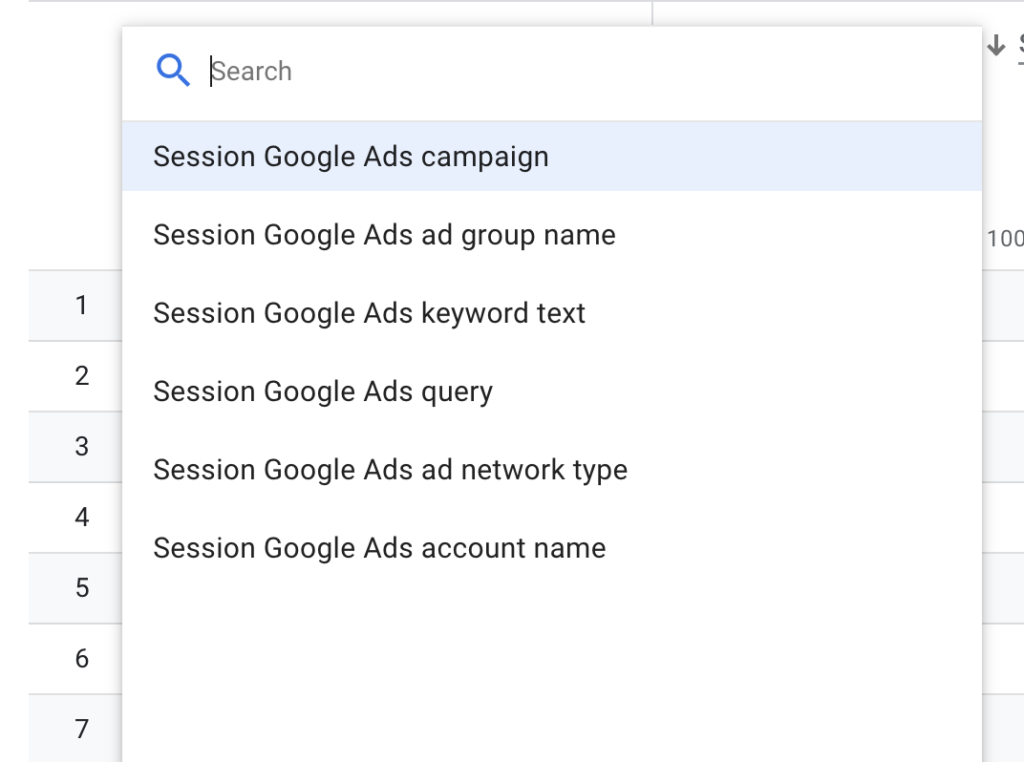
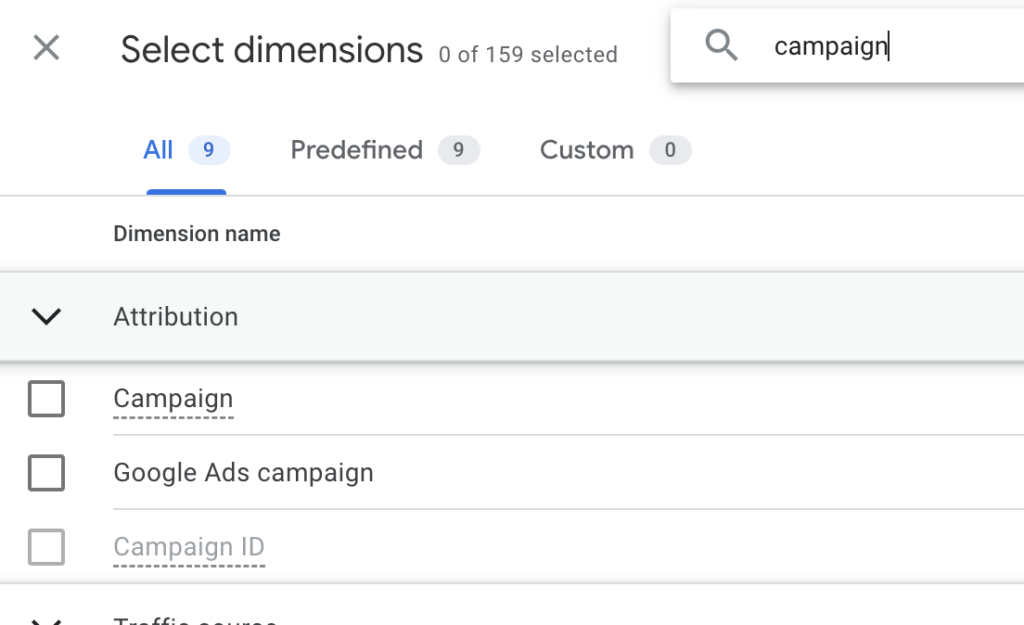
Now we need dimensions, which in our case are Google Ads campaigns. So click on dimensions on your right menu, just above metrics, find Google ads campaign, and import.
Look at the settings right next to your metrics and dimensions. You have to drag your imported metrics to Values, and your dimensions become Rows. This is how it should look.
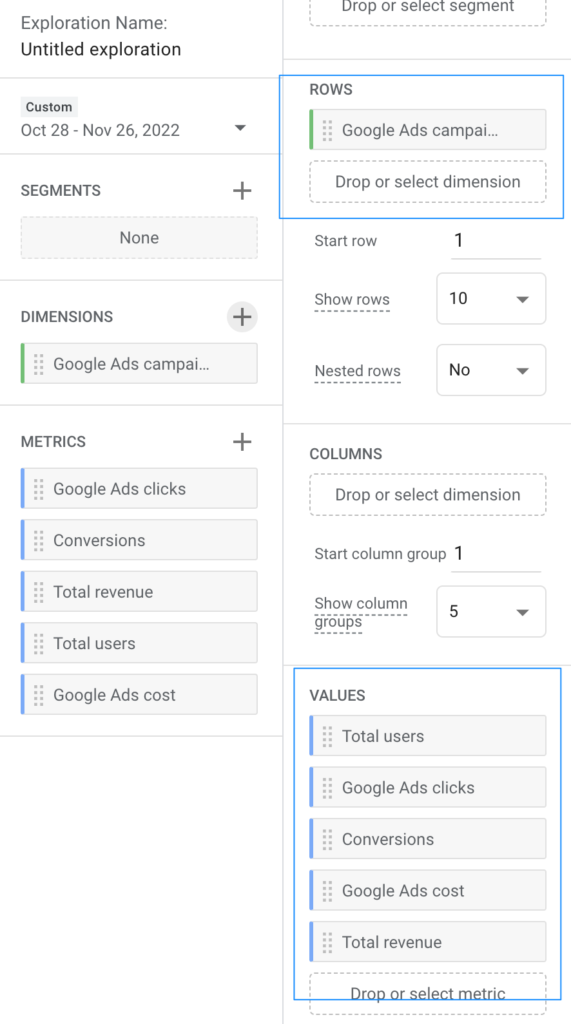
You should see your report populate each time you drag something into it. You can also rearrange values, which will change in the report. This is what you should see.

You may see a (not set) value in the campaign rows. But we can filter out anything we don’t want to see. Scroll down where you dragged your metrics. You should see filters.
Click to add, and select Google ads campaign dimension. Then in the drop-down, find does not exactly match, and write (not set). Click apply.

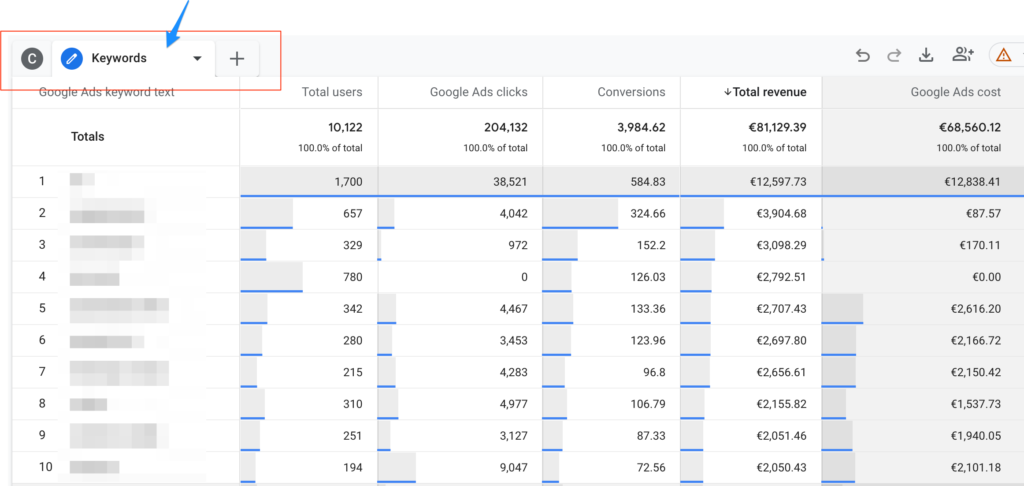
By clicking on each column, you can change by what metric this report is sorted. By default, it should be Users. I clicked on clicks, and it changed.
This is a quick overview where I can see how many conversions and/or revenue my campaigns bring. Which campaigns are more profitable, and so on? If I need to, I can drill down further.
The downside of GA4 custom reports is that I can’t assign a drill-down level. Remember, we could add another dimension, say keywords. Then, if I click on the campaigns in the row, it will open that campaign’s keywords in the same table with the same metrics.
But you can create a view or a tab with different dimensions. Click on the small triangle as shown below, and you can clone your current report.
Then, change the dimension to keywords, and you’re good to go. Not that useful since you see all the keywords. But you can use filters to filter out specific campaigns.
You can have several reports with several tabs or views. They can address different parts of your Google Ads campaigns.
Here are quick tips on how to get started:
- Start with a few metrics to get to know the new creation process.
- Play around with different visualization settings and filters.
- Some metrics are not “compatible” with others. If you get an empty report after dragging a specific metric, it’s probably because of that.
- Since there are a lot of metrics and dimensions, it is much better to consider what you want to see/measure.
- Don’t add too many metrics or dimensions in one report; it will get bulky and confusing. The report’s goal is to give you insights, not confuse you.